Weekly Briefing, Vol. 20, No. 2 (SK), July 2019
Foreign direct investment in Slovakia
![]()
![]()
Overview
Since 1993, Slovakia has been one of the most sought-after investment destinations in the Central and Eastern Europe (CEE) region. Many major investors from the US, Asia (China, Taiwan, South Korea, Japan) and Europe (Germany, Austria, France, Italy) chose Slovakia as a suitable destination for their investments, mainly in the automotive, electrical and IT sectors. Top reasons for investing in Slovakia are presented in table 1. The fact that investors from abroad are interested in Slovakia is also reflected in 70 opened investment projects for 2019 with a total value of 2.7 billion EUR. These projects, if implemented, would bring 24 thousand new job opportunities mainly in eastern regions of Slovakia which are less developed than western and central parts of Slovakia (Finweb, 2019).
According to SARIO (2018), easy implementation and investment security are key factors in considering any investment. Based on this, Slovakia has achieved one of the highest scores in CEE region in terms of property rights security and business simplicity. Slovak labor force is often viewed by foreign investors operating in the country as educated, motivated, adaptable to various types of managerial styles with good language skills and a positive approach to work. Another strength is that Slovakia is one of the leaders in CEE region in labor productivity and freedom of investment (SARIO, 2018).
Table 1 Top reasons for investing in Slovakia
| Safe investment environment regarding political and economic stability |
| Central European hub and favorable geographic location with great export potential |
| Fastest growing Eurozone member within the last 10 years |
| 10-Year CEE Leadership in Doing Business 2002 – 2013 |
| CEE leader in physical property rights security |
| CEE leader in labor productivity |
| High adaptability of labor force to different culture management styles |
| Number 9 worldwide in adapting to new technologies and high innovation potential |
| Using EURO as an official currency as one of a few countries in CEE |
| Large selection of industrial land and offices |
| Steadily growing infrastructure network |
| Attractive investment incentives |
Source: SARIO, 2018.
Regarding the stock and inflow of FDI, table 2 presents the data for the past eight years. We observe a positive pattern in the stock FDI which was growing continually (except 2014) and reached 43 billion EUR in the first quarter of 2019 (26.5% growth since 2012 or 3.3% annually). However, the highest year-on-year growth in stock FDI was recorded in 2016 (40 billion EUR) at 11% compared to the stock of 36 billion EUR in 2015. Unlike the development of the stock FDI, inflow of the FDI was not so smooth recording a decline of 158 million EUR in 2014. On the other hand, the record inflow was recorded in 2016 (1.68 billion EUR) due to new investment projects especially in automotive sector, shared services, technology centers, mechanical engineering and chemical industries.
The growth in overall FDI stock in Slovakia is less significant compared to years 2004-2009. In 2004 Slovakia, together with other countries in the CEE region, joined the EU. The stock of equity capital and reinvested earnings stood at 571 billion SKK or 14.3 billion EUR (average exchange rate for 2004 between SKK and EUR of 39.9375 was used) (ECB, 2019). In 2009, when Slovakia joined the Eurozone, the stock stood at 30.5 billion EUR meaning more than doubling the stock of FDI in Slovakia over the course of only 5 years with an average annual growth rate of 23% compared to total growth rate of 26.5% during 2012-Q1 2019. After joining the Eurozone, the inflow of stock equity capital and reinvested earnings slowed down caused by the global financial crisis and regained momentum again in 2016. Even though the growth in the FDI stock was slower during the second decade than in the first decade of the 21st century, the absolute volume was rather high (change in stock of approximately 9 billion EUR during 2012-Q1 2019.
Table 2 Stock and inflow of FDI 2012-Q1 2019
| 2012 | 2013 | 2014 | 2015 | 2016 | 2017 | 2018 | Q1 2019 | |
| Stock
(EUR billion) |
34 | 35 | 34 | 36 | 40 | 41 | 42 | 43 |
| Inflow
(EUR million) |
623 | 455 | -158 | 306 | 1683 | 1417 | 623 | 875 |
Note: Equity capital and reinvested earnings; 2017-2019 preliminary data.
Source: NBS, 2019.
Regional structure of FDI stock and flow
Figure 1 Map of Slovak regions
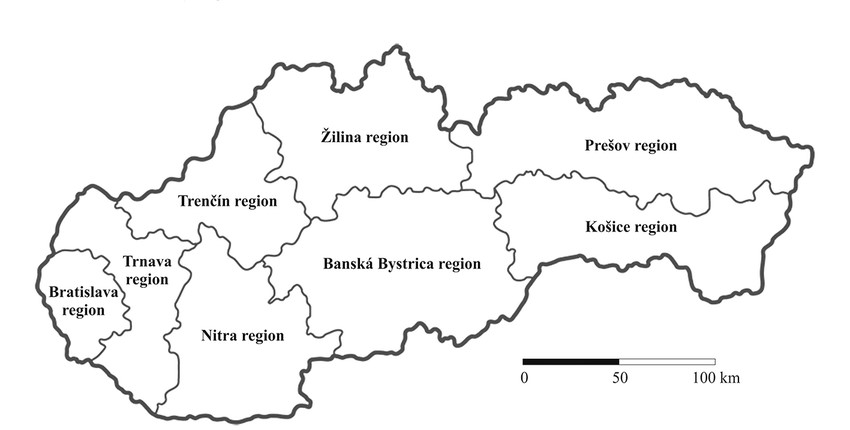
Source: ResearchGate, 2019.
Slovakia is administratively structured into eight regions as shown in figure 1. Bratislava region, located in the south-western part of the country is the most developed region based on macroeconomic indicators and a host of capital of Slovakia – Bratislava. Since many state bodies and administrative capacities as well as private companies in various economic sectors reside in Bratislava, it is not surprising that many foreign direct investment inflows end in this region.
Figure 2 Share of regions on the FDI stock, %
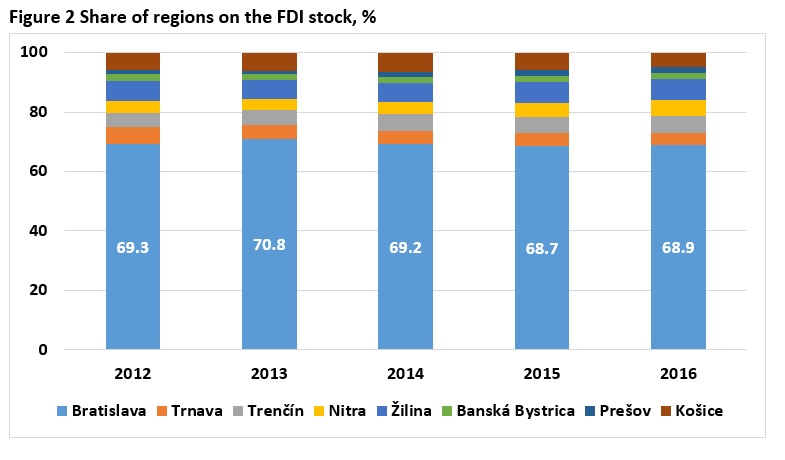
Note: Data available from 2012 – 2016, data for 2017 – 2018 not compiled yet; equity capital, reinvested earnings and debt instruments.
Source: NBS, 2019.
Figure 2 presents the share of the regions on the FDI stock in Slovakia in 2012 – 2016. We observe dominance of Bratislava region in all the years with a share on total FDI stock at around 70%. Even though the data for 2017-2018 are not yet compiled, we assume the same composition of regional shares also in these two years, as well as in 2019. The second ranked region with a share of 6.8% in 2016 was Žilina region. Košice region with the second largest city in Slovakia – Košice – ranked fifth with a share of only 5%. Even though the development in stock FDI was uneven during the observed period in almost all the regions with rising and declining share on total FDI stock, Trnava region was the only region in Slovakia, where the share on total FDI stock continually decreased from 5.7% in 2012 to 3.9% in 2016. On the other hand, the highest increase in the share was recorded in Nitra (from 4.1% in 2012 to 5.4% in 2016) and Trenčín region (from 4.8% in 2012 to 6% in 2016).
Regarding the flow of FDI in the observed period, data are shown in table 3. Trenčín and Prešov regions were only two regions with continuous positive inflow of FDI with Trenčín ranked number one in 2016 with a total inflow of 445 million EUR, followed by Banská Bystrica region with 422.6 million EUR. Overall, the long-term tendency for inflow of the FDI to individual Slovak regions is in favor of Bratislava region because of the favorable conditions regarding the highly qualified and flexible labor force, its location (closeness of Vienna, Prague and Budapest) and developed infrastructure comparing to regions in the eastern part. However, there is a notion to address the poorer region of Slovakia and make them more attractive for foreign investors mainly through state incentives regarding FDI.
Table 3 FDI inflow to regions, million EUR
| 2012 | 2013 | 2014 | 2015 | 2016 | |
| Bratislava | 1489,7 | 373,4 | -433,9 | -537,5 | -107,1 |
| Trnava | 602,2 | -428,2 | -154,9 | 110,1 | 33,9 |
| Trenčín | 106,1 | 65,3 | 51,2 | 86,9 | 445,0 |
| Nitra | 180,7 | 57,6 | -1,8 | 293,2 | 67,5 |
| Žilina | 25,9 | -46,7 | 29,8 | 185,5 | -101,7 |
| Banská Bystrica | 9,7 | -377,0 | 96,9 | 28,6 | 422,6 |
| Prešov | 71,2 | 70,4 | 15,1 | 204,8 | 97,6 |
| Košice | -164,8 | -169,7 | 11,5 | -275,8 | -129,7 |
Note: Equity capital, reinvested earnings and debt instruments.
Source: NBS, 2019.
Sectoral structure of FDI stock
This part uses the statistical classification of economic activities in the EU – NACE (Nomenclature statistique des activités économiques dans la Communauté européenne) Revision 2. Broad structure of NACE Rev. 2 is available in NACE (2008, p. 57), detailed structure in NACE (2008, pp. 61-90).
Figure 3 Sectoral distribution of FDI stock, %
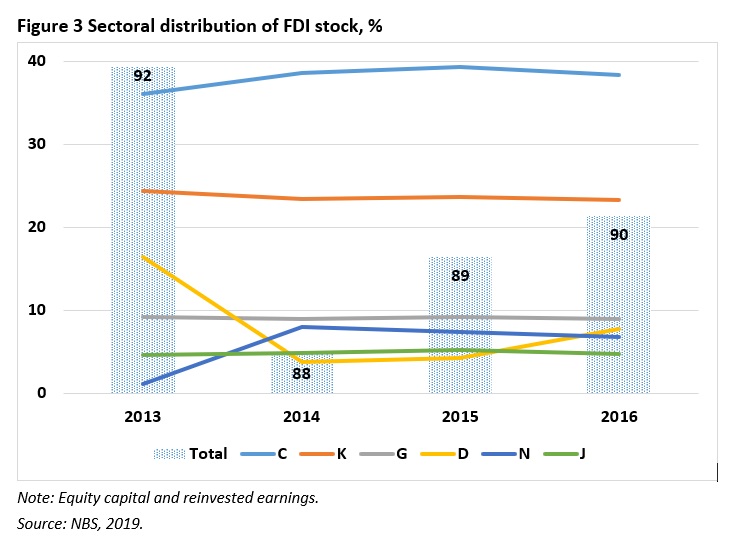
Note: Equity capital and reinvested earnings.
Source: NBS, 2019.
Figure 3 shows the share of major NACE activities on total FDI stock (equity capital and reinvested earnings) as well as their share on overall FDI stock. Since 2013, share of activities C (Manufacturing), K (Financial and insurance activities), G (Wholesale and retail trade), D (Electricity, gas, steam and air conditioning supply), N (Administrative and support service activities) and J (Information and communication) on total FDI stock in Slovakia reached approximately 90% (blue columns). From these, the highest share of approximately 40% goes for NACE activities C, followed by K. We note more or less the same share in the observed period for all the above mentioned activities with the exception of activities D and N. While D lost its share from 16.5% in 2013 to 7.7% in 2016 (with a significant decline between 2013 and 2014 from 5.81 billion EUR to 1.3 billion EUR respectively), activities N recorded an increase from 1.05% in 2013 to 6.8% in 2016 with a notable increase also between 2013 and 2014 from 0.4 billion EUR to 2.7 billion EUR respectively.
Figure 4 presents top 10 FDI stocks based on NACE Rev. 2 2-digit activities in 2016. Even though C activities have greatest overall share of FDI stock (38.3% in 2016), based on further decomposition to subcategories of NACE activities, activity K64 (Financial intermediation, except insurance and pension funding) had a stock of 7.9 billion EUR in 2016 (reaching almost 20% of total FDI stock for 2016).
Figure 4 Top 10 FDI stocks in 2016, billion EUR
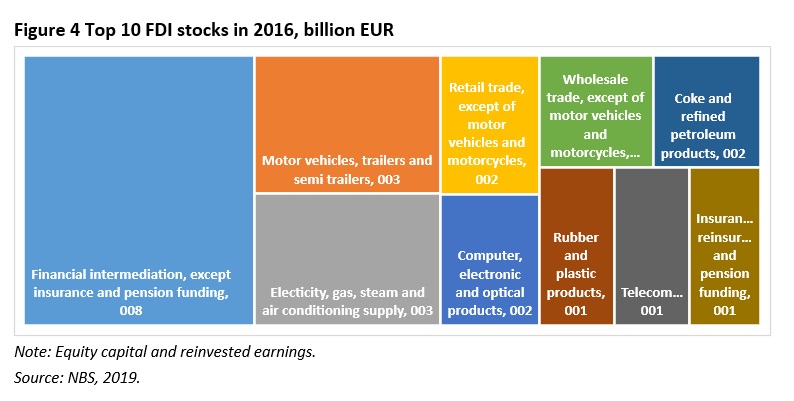
Note: Equity capital and reinvested earnings.
Source: NBS, 2019.
Conclusion
Slovakia is one of the most important investment destinations in the CEE region with many major investors from the North America, Asia and Europe. Most of the FDI inflows are allocated into a small number of activities, especially manufacturing (automotive, electrical, chemical sectors), financial and insurance sector and IT sector. Since joining the EU in 2004, the total FDI stock (including equity capital and reinvested earnings) has risen substantially by almost 30 billion EUR (from 14.3 billion EUR in 2004 to 43 billion EUR in Q1 2019). Regarding the regional distribution of FDI stock, we conclude and note rather uneven distribution among the Slovak regions with the greatest share of FDI stock in Bratislava region of almost 70% in the observed period. Sectoral distribution of FDI stock is also asymmetrical with only a small number of NACE activities representing around 90% of total FDI stock in the observed period. Majority of the FDI stock is comprised only in two activities – Manufacturing (C) and Financial and insurance activities (K) with an overall share of 62% on the FDI stock in 2016.
References:
- (2019). Statistical Data Warehouse. Available on-line: http://sdw.ecb.europa.eu/quickview.do?SERIES_KEY=120.EXR.H.SKK.EUR.SP00.A&periodSortOrder=ASC.
- (2019). Na Slovensku by tento rok malo vzniknúť 24-tisíc pracovných miest. Polovica na východe. Available on-line: https://finweb.hnonline.sk/ekonomika/1912396-na-slovensku-by-tento-rok-malo-vzniknut-24-tisic-pracovnych-miest-polovica-na-vychode.
- (2008). NACE Rev. 2. Statistical classification of economic activities in the European Community. Available on-line: https://ec.europa.eu/eurostat/documents/3859598/5902521/KS-RA-07-015-EN.PDF.
- (2019). Priame zahraničné investície. Available on-line: https://www.nbs.sk/sk/statisticke-udaje/statistika-platobnej-bilancie/priame-zahranicne-investicie.
- (2019). Development tendencies of regional disparities in the Slovak Republic. Available on-line: https://www.researchgate.net/figure/The-self-governing-regions-NUTS-III-in-Slovakia-in-2014_fig1_319388358.
SARIO (2018). Prečo investovať na Slovensku. Available on-line: https://www.sario.sk/sk/investujte-na-slovensku/preco-investovat-na-slovensku