Weekly Briefing, Vol. 37, No. 3 (LVA), February 2021
Changes in Latvian social strata in the past 30 years
![]()
![]()
Introduction
The last 30 years for Latvia have been very fruitful but it is difficult to say that only positive changes had a place in the social structure. The overall trend of life quality is increasing. However, the most challenging issue for the country since the accession to the European Union is the population outflow and aging. The important note is that the full independence of Latvia after the dissolution of the Soviet Union was in 1991.
To analyse the changes in Latvian social strata vital social indicators are used such as average monthly wages, minimum monthly wages, the purchasing power of employed population, enrolment and graduation in the higher education institutions and colleges active population employment status and average old-age pensions in the country.
Dynamics of income in Latvia
To get a better understanding of current social stratification in Latvia and compare it with the last two decades, the main indicator to analyse is average monthly wages and salaries, as it reflects the situation for the majority of the population.

Figure 1
Dynamics of average monthly wages and salaries
Source: Image developed by the authors using CSB[i] data and calculation results
As shown in the Figure 1, the wealth of Latvian society is growing yearly, which is one of the main indicators of the growing middle class in the country. According to the World Bank country classification[ii], Latvia now is the high-income economy on the world stage. Comparing with the last two decades, there is a significant increase in average wages of Latvian citizens. It can be said that in the ‘90s Latvia was fighting mass poverty in the country, and now there is the aim to reach a middle-class level for the whole country.
The changes in the national minimum monthly wages are also a significant indicator of social stratification mobility of the country as it is help to reduce poverty and increase social protection of the society.
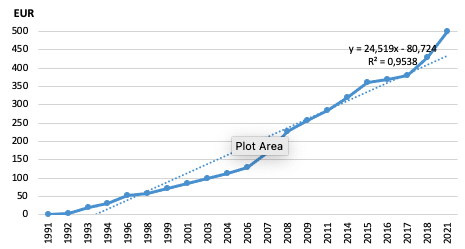
Figure 2
Dynamics of national minimum monthly wages and salaries
Source: Image developed by the authors using CSB data and calculation results
Figure 2 illustrates the dynamics of minimum monthly income in Latvia. The last increase was on the 1st of January 2021 and now reach EUR 500. Overall, the trend is the positive and purchasing power of people with the minimum wage in Latvia is growing steadily. The most difficult times were in the first years of the country’s independence. The interesting comparison is that in 2007 the average monthly wage was on approximately the same level (the difference is EUR 66) as the minimum wage in 2021.
For a clearer understanding of the changes in society for the last 3 decades the purchasing power of several widely used products is compared (1995 was the first year with available statistics):
Table 1
Purchasing power of employed population
| 1995 | 2000 | 2005 | 2010 | 2015 | 2020 | 2020/1995 | |
| Beef, kg | 56 | 76 | 94 | 119 | 126 | 146 | 161% |
| Milk, litre | 319 | 493 | 502 | 620 | 793 | 927 | 191% |
| White bread, kg | 167 | 213 | 293 | 288 | 363 | 444 | 166% |
Source: Table developed by the authors using CSB data and calculation results
The dynamic is positive and rather intensive, so the purchasing power of beef and white bread increased more than thrice, while the purchasing power of milk skyrocketed almost four times since 1995. This data shows that the level of life has increased not only in the currency value but also with the significant increase in products that the population can afford.
Dynamics in the education and employment of the population
Vital indicators for social stratification are level of education and employment in the country. As the provision of elementary and secondary education was not an issue for Latvia since the declaration of independence and before it, the most interesting changes for social stratification are reflected in the number of people attending higher educational institutions and unemployment statistics.
Table 2
Enrolment and graduation in the higher education institutions and colleges
| 1995 | 2000 | 2005 | 2010 | 2015 | 2020 | 2020/1995 | |
| Enrolment per 10 000 population | 189 | 430 | 589 | 501 | 428 | 413 | 119% |
| Enrolled | 12 983 | 32 950 | 43 826 | 31 012 | 29 083 | 29 504 | 127% |
| Graduates with awarded degree | 8 333 | 15 009 | 26 124 | 26 545 | 17 021 | 14 370 | 72% |
Source: Table developed by the authors using CSB data and calculation results
The most notable indicator here is that already after ten years of independence enrolment per 10 000 population had skyrocketed (from 189 people in 1995 to 430 people in 2000), this indicator shows the increase in the share of educated people in Latvia. So, the increase between 1995 and 2020 is 119% (from 189 to 413 per 10 000 population), showing that the Latvian population has become more educated.
Even though Latvian citizens have more resources and opportunities now in comparison with the past two decades, but due to population outflow the number of people who are planning to receive a higher education is not growing. It is connected to the fact that after the accession of Latvia to the European Union, a lot of people emigrated to other EU countries and the majority of these people are young. They could be the potential students and labour force. However, the elder population does not emigrate, therefore, this demographic imbalance has caused a slight declining trend in the number of people in higher educational institutions.
Table 3
Active population employment status
| 1996 | 2000 | 2005 | 2010 | 2015 | 2020 | 2020/1996 | |
| Active population | 71,7 | 67,2 | 69,1 | 73,0 | 75,7 | 77,6 | 8% |
| Employed | 57,0 | 57,3 | 62,1 | 58,5 | 68,1 | 73,5 | 29% |
| Unemployed | 14,7 | 9,8 | 7,0 | 14,5 | 7,6 | 7,7 | -48% |
Source: Table developed by the authors using CSB data and calculation results
In general, the active population has increased by 8% for the last three decades. Considering, the outflow of people due to EU accession, this indicator illustrates a positive and encouraging result. The increase can be explained by the immigration of people from third world countries to Latvia, especially from post-Soviet countries.
The percentage of employed increased by 29%, which is an extremely significant change, considering that the world crisis in 2008 had a huge negative impact on the Latvian economy. At the same time, the unemployed population decreased by 48% since 1995. This indicates overall positive changes in the country’s economy and people’s level of life. A slight decrease in 2020 is explained by the Covid-19 crisis, which will have an impact on the economy of Latvia in the next few years. In 2021 the unemployment rate is expected to grow, for example at the end of January this year, the registered unemployment rate in Latvia reached 8% of the economically active population, which is 0.3 percentage points more than a month earlier, according to the State Employment Agency.[iii] To be more exact, at the end of January this year, a total of 72,612 unemployed people were registered with the State Employment Agency, which is 3,007 people more than a month earlier, when 69,605 unemployed people were registered with the agency.
Old-age pension dynamic
Social protection of the population illustrates the ability of the state to decrease the stratification and improve the level of life in the country. The main indicator here is the size of the old-age pension:
Table 3
Average old-age pensions in EUR
| 1991 | 1995 | 2000 | 2005 | 2010 | 2015 | 2020 | |
| Old-age pensions | 1,11 | 42,93 | 82,23 | 114,58 | 250,25 | 273,40 | 367,05 |
Source: Table developed by the authors using CSB data and calculation results
The level of pension in Latvia has increased significantly for the last 3 decades, and the growth is stable without any fluctuations. A developed society is characterized by a high level of social protection, and as it can be seen Latvia is on the way to becoming one.
Summary
Throughout the last 30 years, Latvia has faced a plethora of significant changes, which influenced social stratification in the country. In general, the population has become wealthier and safer but still, the biggest challenge of the country is the outflow of people abroad and population aging. Due to emigration a lot of young people and potential students and labour force had left the country. Therefore, now the increase in active population compensate immigration of people from the third world countries.
Latvia is moving to the middle-class economy, where the level of social stratification is low. Active population is growing as well as per cent of employed people. Besides, the main indicators of income and purchasing power of the population continue increasing. Finally, social protection is improving from year to year, meaning that citizens of the country can have a better understanding of their future life and protection from the state. The final goal is to reach the level of social protection that allows maintaining a way of life of the average employed person for everyone in society. However, the main question is how to retain the population in the country and attract those who have already left, and to overcome COVID-19 negative impact on the Latvian economy.
[i]Central Statistical Bureau of Latvia. Available at: https://www.csb.gov.lv/lv/sakums
[ii]The World Bank. (2021). World Bank Country and Lending Group. Available at: https://datahelpdesk.worldbank.org/knowledgebase/articles/906519-world-bank-country-and-lending-groups
[iii] LSM.lv. (10.02.2021). Reģistrētā bezdarba līmenis Latvijā janvāra beigās sasniedzis 8%. Available at: https://www.lsm.lv/raksts/zinas/ekonomika/registreta-bezdarba-limenis-latvija-janvara-beigas-sasniedzis-8.a392287/